Reports
What are Reports?
- Reports play a crucial role in financial management and decision-making. They provide a comprehensive view of a company’s financial health, performance, and transactions.
How do you view Reports?
View Reports
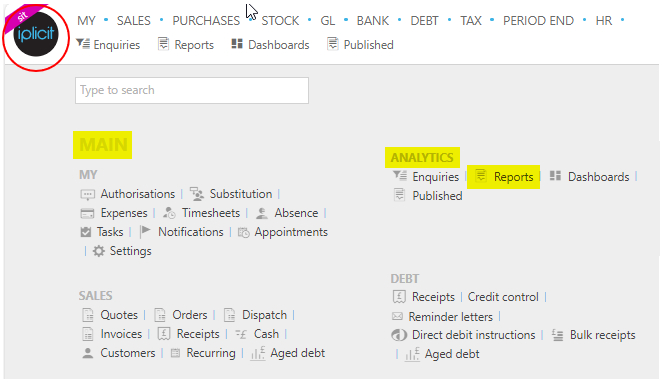
Select Analytics / Reports from the Main section of the pulse menu -
Note
This is an example screen shot of the pulse menu.
Position of the menu items within pulse will vary according to available options and dependant on personal screen resolution.
or from the Main Menu select Analytics then Reports -

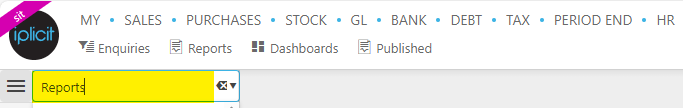
or enter Reports in the Quick Launch Side Menu.
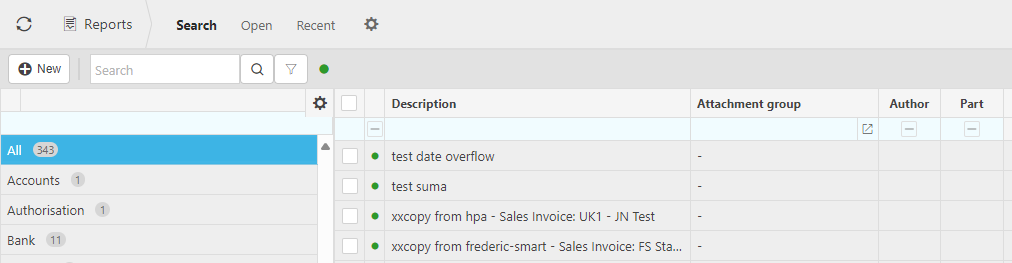
This will then show the Reports on the system where normal customisation of Sets can be used.
Tip
To modify the columns displayed, select  on the top right of the page, then tick/untick the information you want to hide or display.
How to run a Report?
Running a Report
Select Reports from one of the options as shown above in View Reports.
Select one of the pre-defined Reports.
Note
There are pre-defined reports that should most scenarios for all documents.
- For example, Purchase Orders UK1, UK2, UK3 and UK4
These reports are created which will use the Report override settings in the appropriate Legal entity on the Stationery and images tab.
Overrides only apply if that field exists on the report you're applying to. E.g. UK4 doesn't have a registered address.
If an override is set for a field that isn’t present in a particular report, that override will have no effect on the report generated from that report. In other words, an override only applies when the corresponding field exists on the selected report.
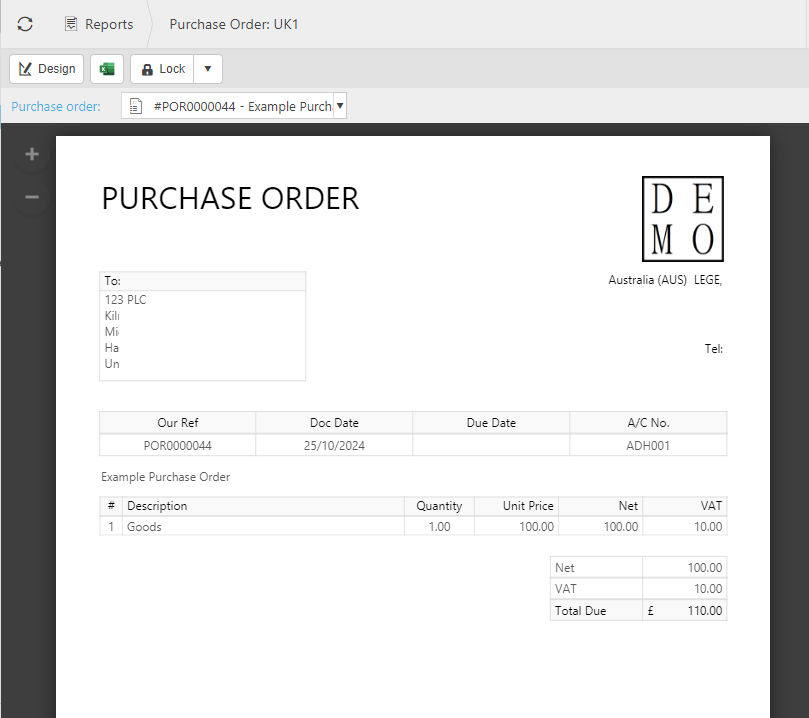
For report Purchase Order UK1, for example, enter the Purchase order
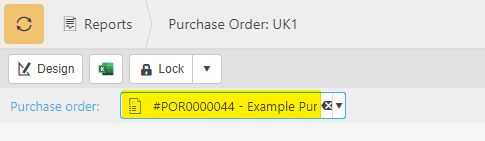
Select the
 icon to view the report.
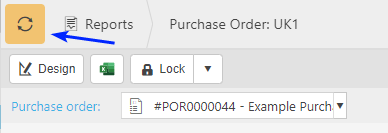
The report will now show with the correct Override settings as defined previously.
How to edit a Report?
Edit a Report
Select Reports from one of the options as shown above in View Reports.
Select one of the non-authored, pre-defined Reports, then select Design -
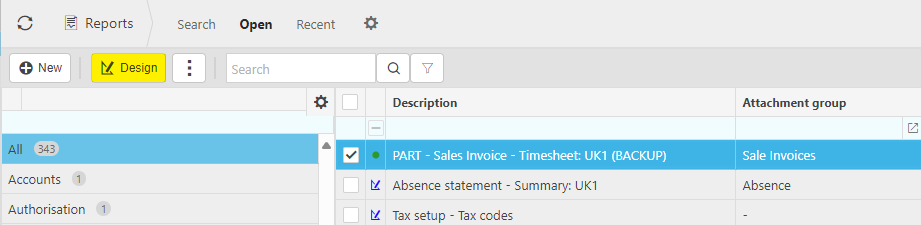
or select and open one of the non-authored, pre-defined Reports, then select Design -
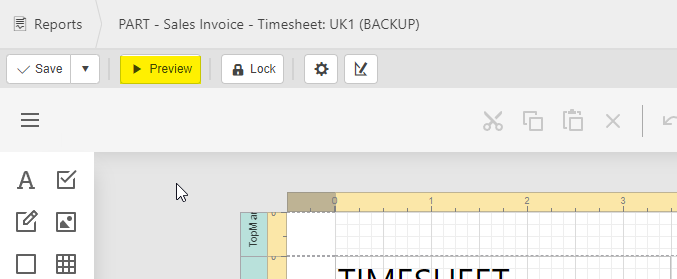
The Report design page now appears ready for any changes/additions/formats.
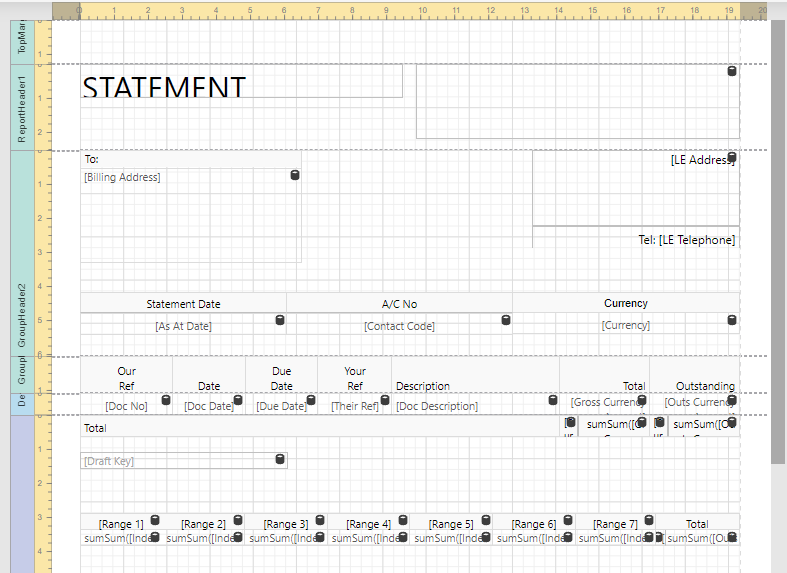
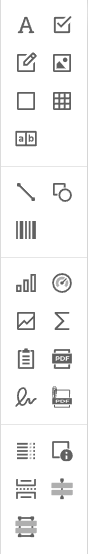
Select and drag charts/graphs from left-hand menu to main page - hover over individual icons in this menu to see their function.
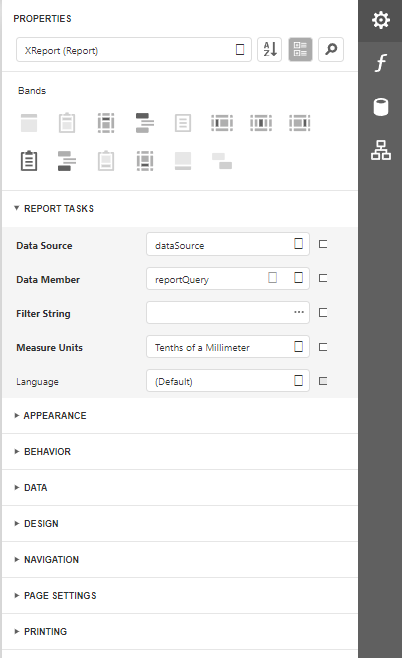
Other Report properties, formatting, appearance, design, settings etc. can be setup in the right-hand menu.
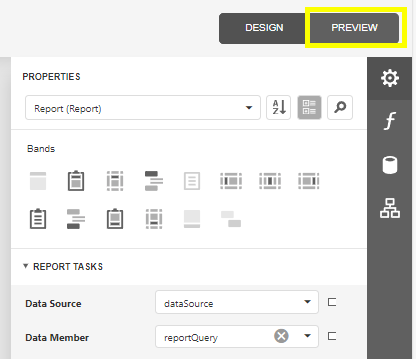
Selecting the Preview button will show how the Report will look.
Select Save when finished.
How to create a new Report?
Create a new Report.
Select Reports from one of the options as shown above in View Reports.
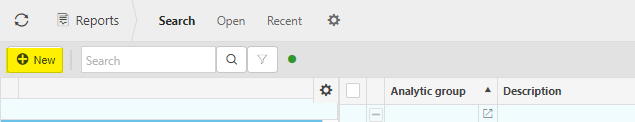
Select New.
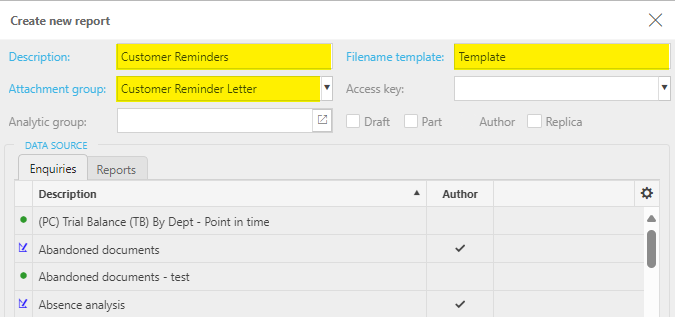
Enter Description, Filename template and Attachment group.
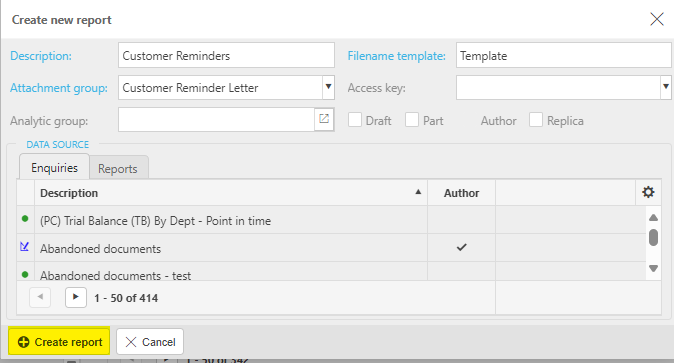
Select Create report.
The Report design page now appears ready for any changes/additions/formats.
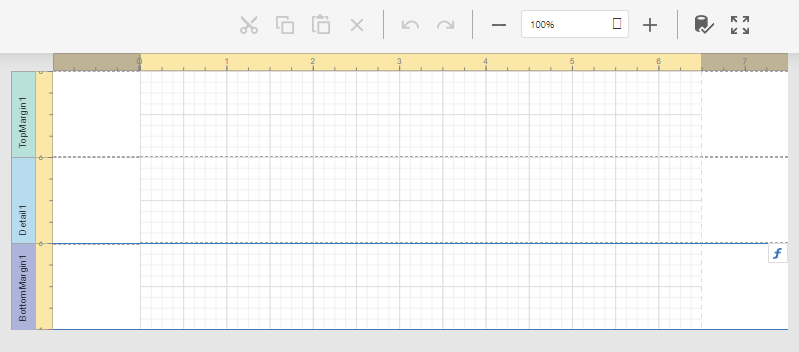
Select and drag charts/graphs from left-hand menu to main page - hover over individual icons in this menu to see their function.
Other Report properties, formatting, appearance, design, settings etc. can be setup in the right-hand menu.
Selecting the Preview button will show how the Report will look.
Note
Selecting the Preview button in the top menu bar, will save any changes before showing the preview.
Select Save when finished.
Updated April 2025