Dashboards
What are Dashboards?
Dashboards are reports that shows selected data in various forms - e.g. Tables, graphs, images etc.
All Dashboards are based on Enquiries
Some Dashboards are pre-defined and can't be edited.
Customers can create their own Dashboards.
Note
Dashboards will have a limit to the number of rows returned.
When the maximum row value is breached, a banner will be displayed at the top of the finder menu showing the number of rows returned.

It will also have a Learn more link to Limits and filtering, giving advice on how to reduce the number of rows returned.
Note
To view the legacy version, please select Legacy User Guide.
How do you view Dashboards
View Dashboards
As per Generic Navigation options, either from left-hand navigation panel, select Dashboards from the Analytics folder or enter Dashboards in the Search option.
This will then show the Dashboards on the system where normal customisation of Sets can be used.
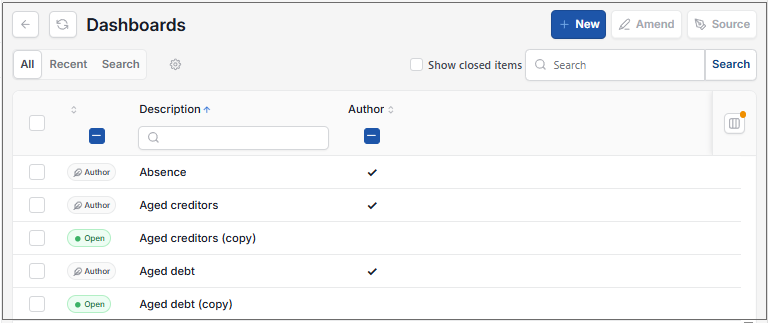
Tip
To modify the columns displayed, select  option on the right of the column display, then tick/untick the information you want to hide or display.
How to use Dashboards
Use Dashboards
Select Dashboards from one of the options as shown above in View Dashboards.
Select and open one of the pre-defined Dashboard.
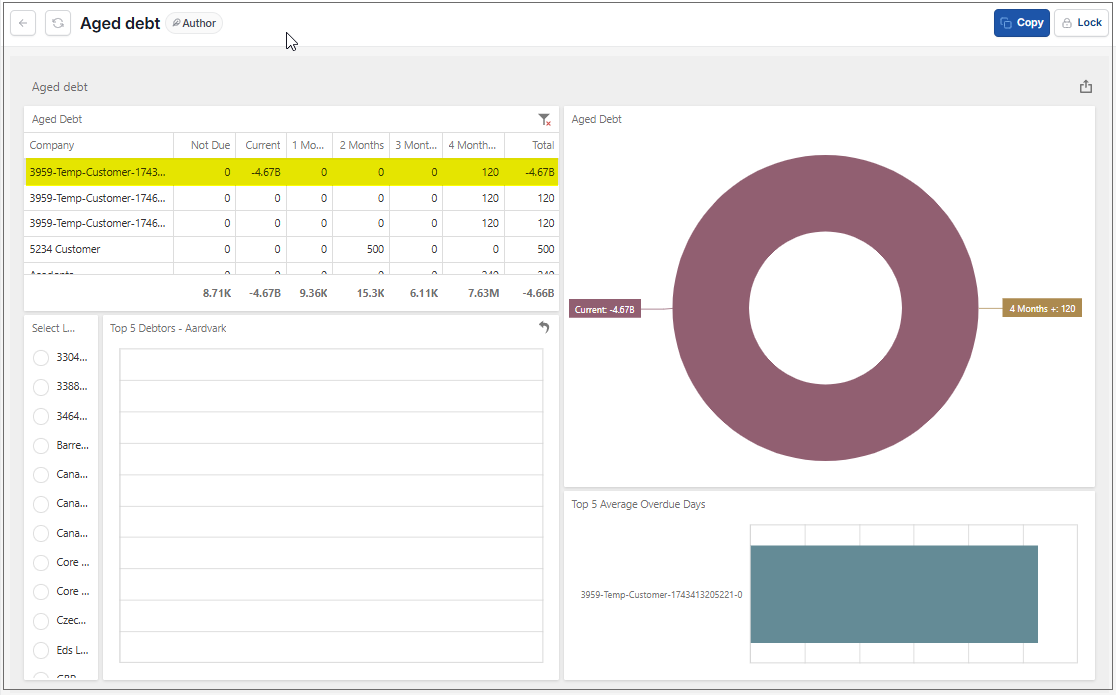
Results will automatically be produced.
For example -
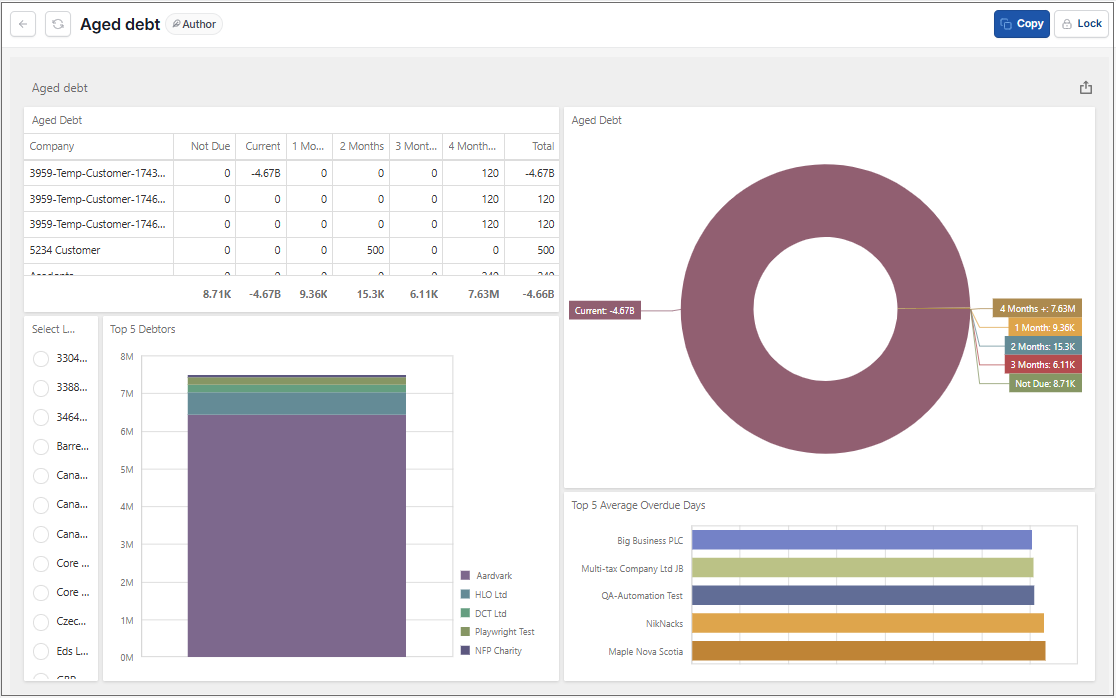
Various options are available for interrogating the data.
Hovering over areas will show further breakdown of data.
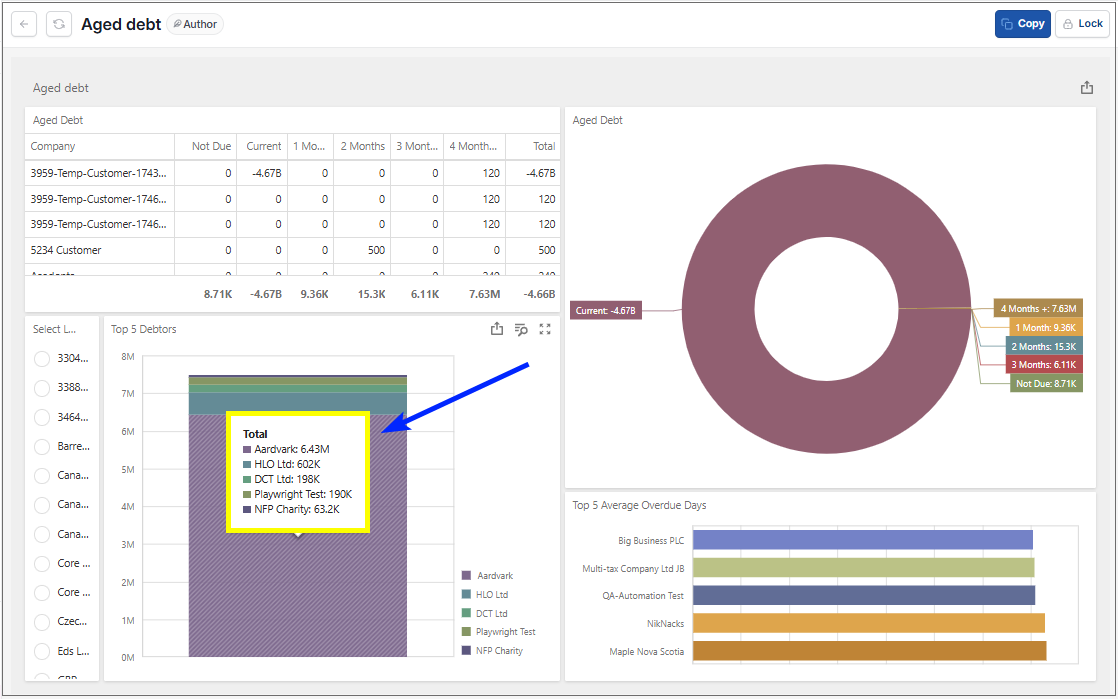
Each chart/graph with have icons in top right, allowing further actions such as Export (pdf, Excel or Image), Inspecting data, enlarging chart/graph to full screen.
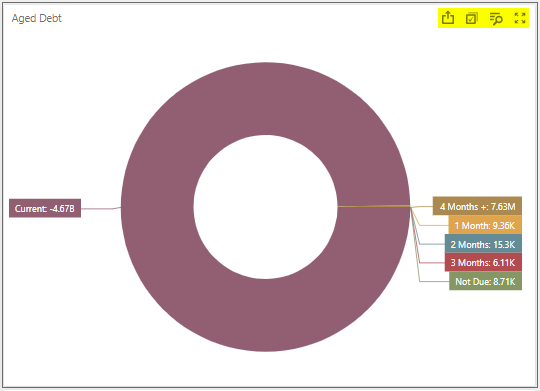
Select any individual section within a chart/graph will show associated data results in any other chart/graph on the Dashboard.
Select the
 icon will reset the chart/graph back to the default setting.
How to create a Dashboard
Create a Dashboard
Select Dashboards from one of the options as shown above in View Dashboards.
Create a new Dashboard by either -
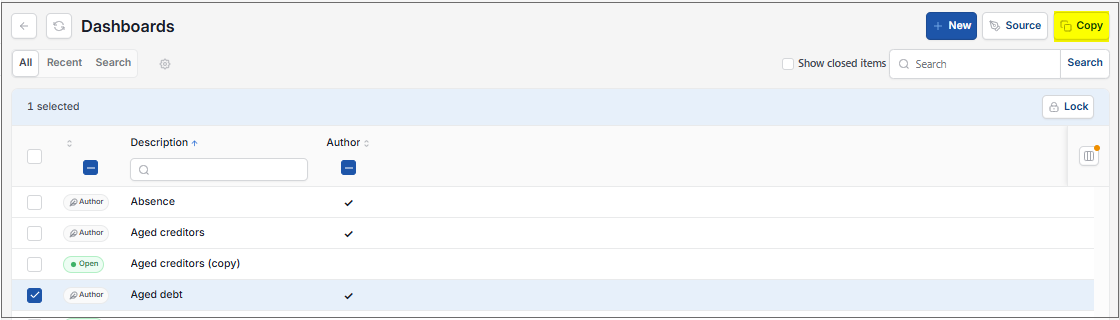
Select and open one of the pre-defined Dashboard, then select Copy.
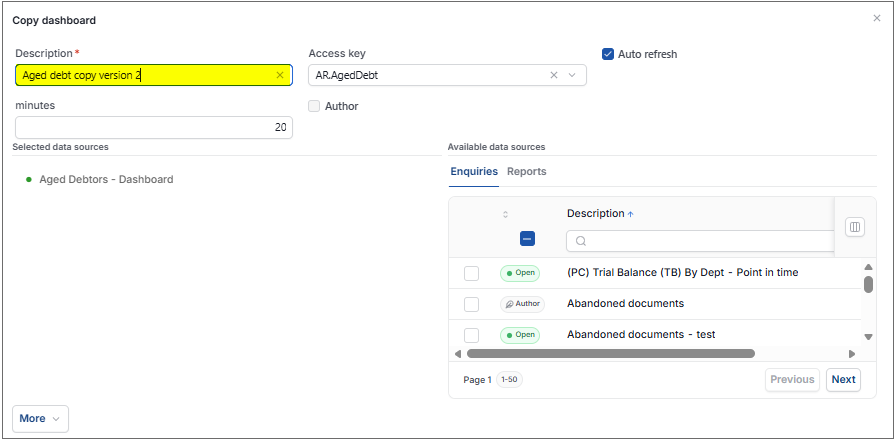
Enter a new description for the new Dashboard.
Select Save a copy via the
 option, then Edit to make changes.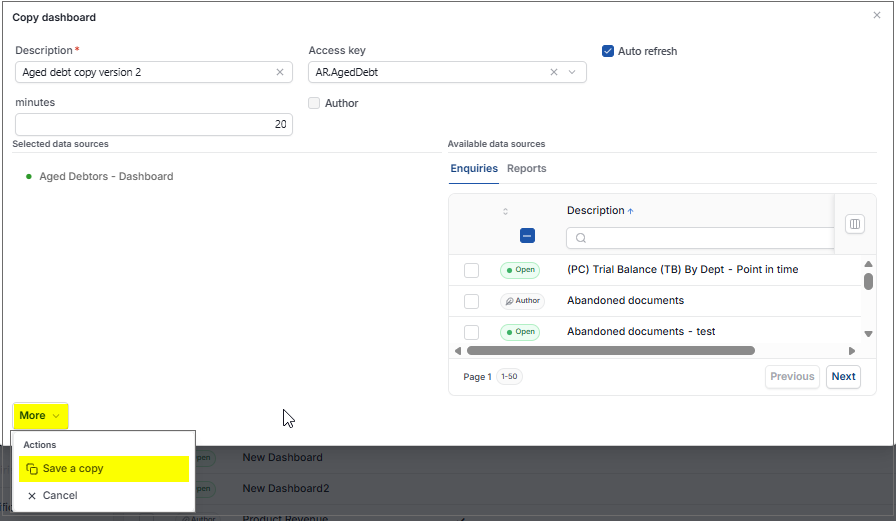
or
Select New
Enter new description and data information locations.
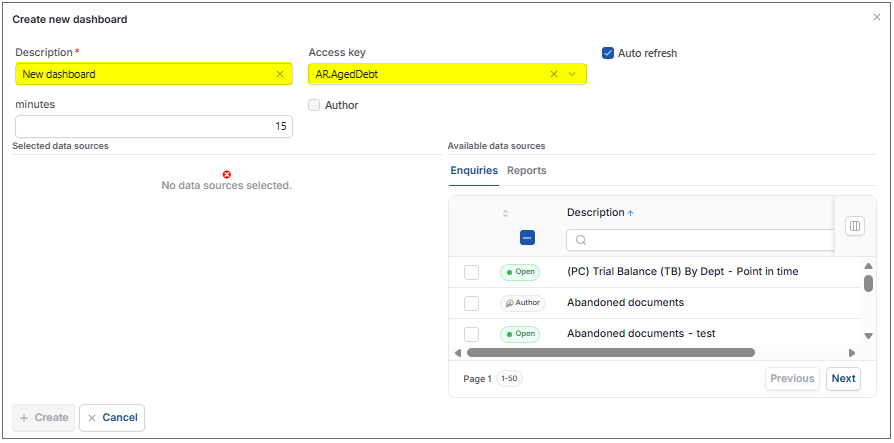
Select Create, then Edit to make changes.
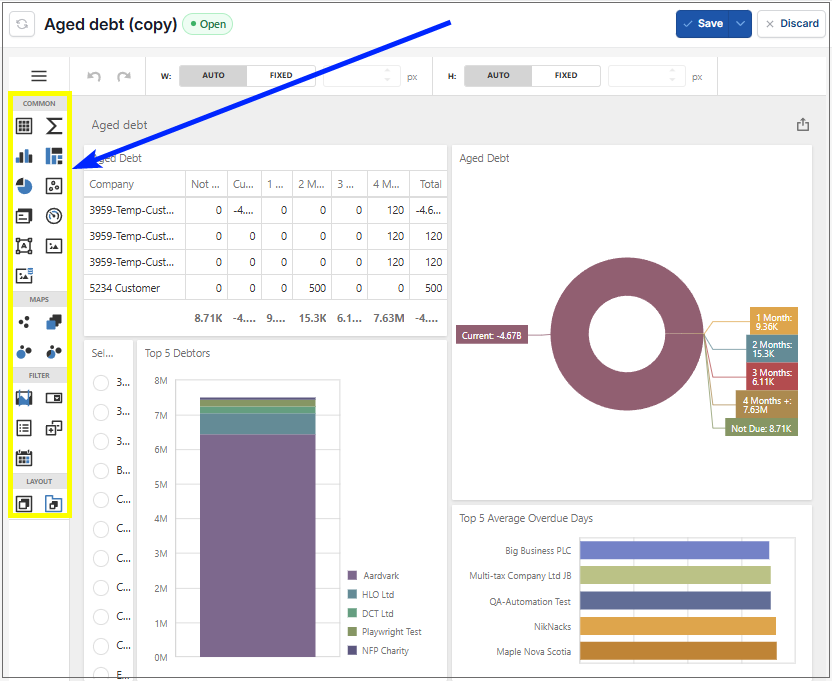
Select and drag charts/graphs to main page.
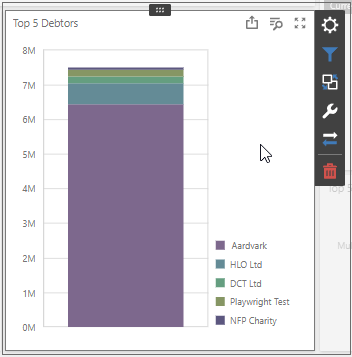
Make changes to charts/graphs by clicking on them and select the appropriate icon on the side menu that pops up.
Cog: Various data options.
Tip
One useful option here is the Top N option.
Can set to show the Top N (e.g. Top 5) values only.
Filter: Filter data.
Interactivity: Interactions available.
Options: Display options and formats.
Convert To: Change to another type of chart/graph.
Tip
Selecting individual sections, presents further options.
The resulting data will then show in other charts/graphs on the dashboard.
Delete: Removes chart/graph from Dashboard
Select Save to complete creation.
Updated September 2026