AI Insights
AI Insights provides a conversational analytics assistant that transforms natural language questions into powerful data visualisations and business insights.
This will enable Customers to get much better access to data by being able to quickly create a report by using plain English.
The Basics
- Type your question — Ask about your data naturally
- View your results — Charts and tables appear automatically
- Explore further — Ask follow-up questions to drill deeper
Warning
AI Insights requires additional chargeable licences, which include credits, in order to use the AI features.
Please speak to a member of the Customer success team via customersuccess@iplicit.com for more information.
How to view AI Insights
As per Generic Navigation options, either from left-hand navigation panel, select AI Insights from the Insights folder or enter AI Insights in the Search option.
This will then show the AI Insights screen.
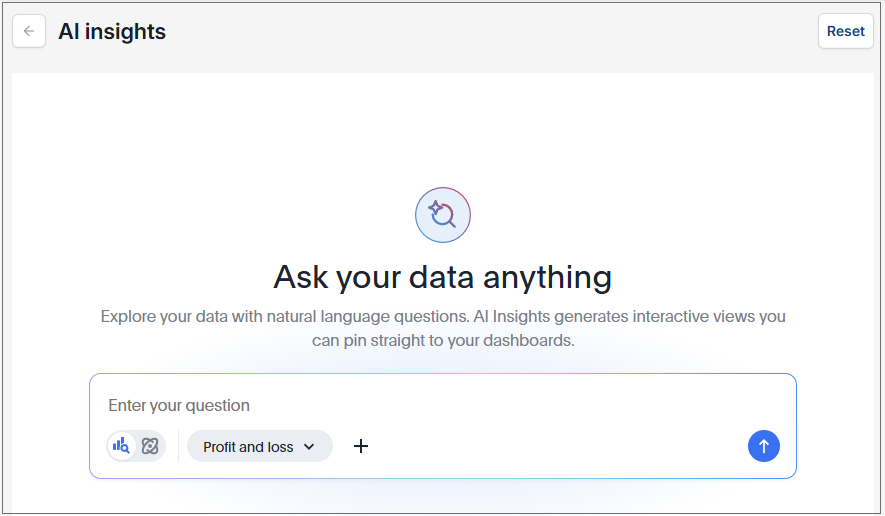
How to run AI Insights
Using Profit & Loss as an example. But you can look at Debtors, Creditors, Budget and a whole host of data within iplicit.
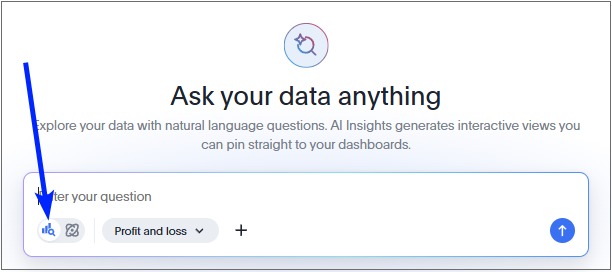
You can select either a quick search ...
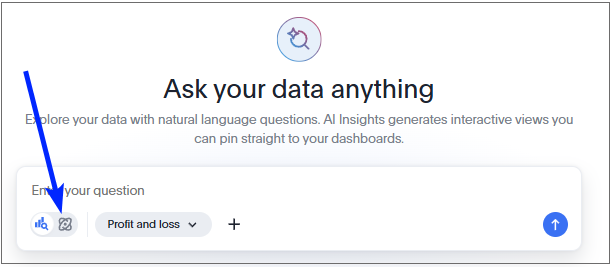
... or a deep search.
Simply type your question in plain English.
- For example, Analyse my trading income by the category within my chart of accounts, category headings and by department. I want to see some key trends, but I'd like to see it with some visualisations too.
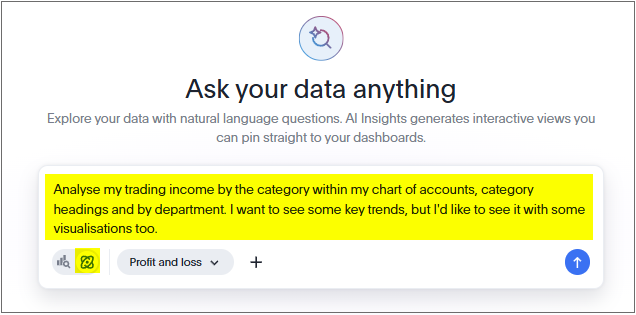
Select the  button to submit the question.
As the result is processed, it shows exactly what it is doing so you have all of the details for everything that it is looking at.
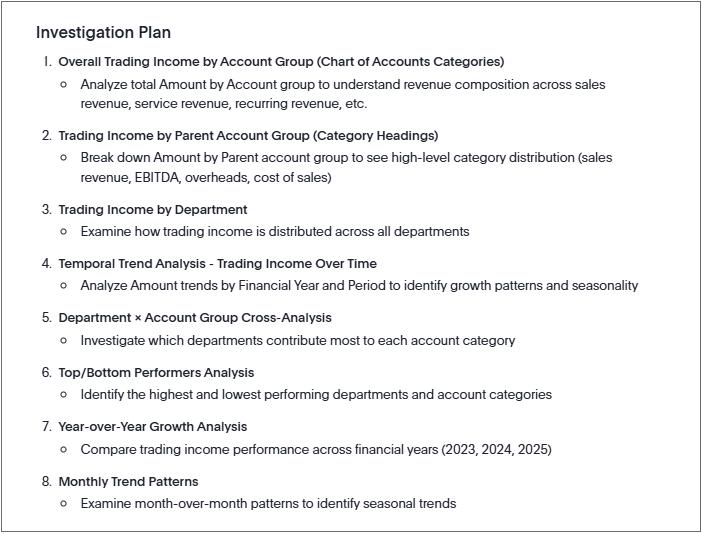
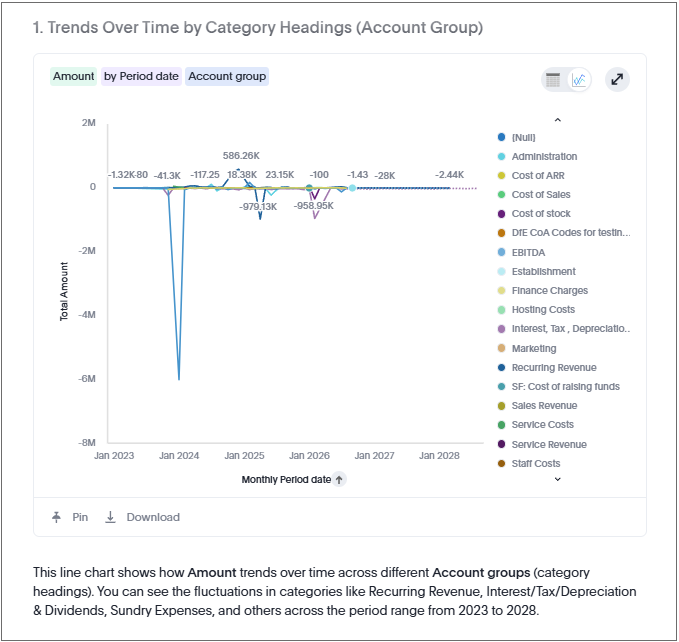
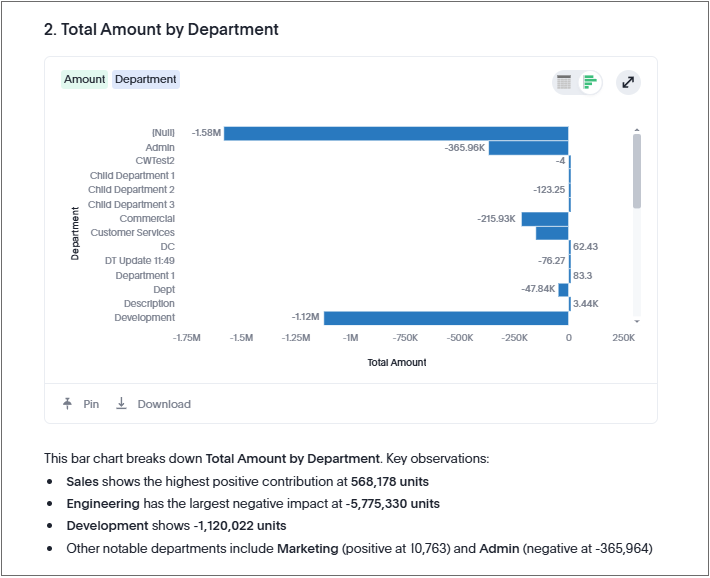
Examples of outputs.
How to create a Dashboard
From the above results, you can create your own Dashboard.
To add one of the resulting graphs, select the
 option at the base of the graph.
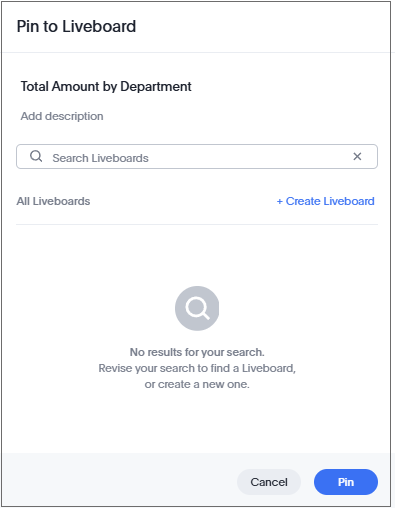
Either add to an existing Dashboard or create a new Dashboard.
View resulting Dashboards via Boards option.
Types of Questions You Can Ask
Summary & Totals
- "What is our total revenue?"
- "How many orders did we receive this year?"
- "Show me the average deal size"
Trends Over Time
- "Show monthly sales for the past year"
- "What's the weekly trend in customer sign-ups?"
- "Compare quarterly performance year over year"
Rankings
- "Top 10 products by revenue"
- "Which regions have the lowest profit margins?"
- "Best performing sales reps this quarter"
Breakdowns & Groupings
- "Revenue by product category"
- "Customer count by country and segment"
- "Sales split by channel"
Comparisons
- "Compare this quarter vs last quarter"
- "East region vs West region sales"
- "How does 2024 compare to 2023?"
Driver Analysis
- "Why did revenue increase last month?"
- "What's causing the drop in orders?"
- "Explain the change in profit margin"
Building on Your Results
AI Insights remembers your previous questions, so you can naturally refine your analysis:
- Start with "Show revenue by region", then follow up with "Now filter to just Q4"
- Start with "Top 10 customers", then follow up with "Break that down by product"
- Start with "Monthly sales trend", then follow up with "Why did June spike?"
Customising Your View
Request Specific Chart Types
- "Show that as a pie chart"
- "Display as a bar chart"
- "I want to see this as a table"
Adjust Filters & Time Periods
- "Filter to North America only"
- "Show me just last quarter"
- "Exclude cancelled orders"
Change Sorting & Limits
- "Sort by revenue descending"
- "Show top 5 instead"
- "Include all categories"
Exporting Your Analysis
Generate Reports
Ask for a summary document when you're ready to share:
- "Create a report of our findings"
- "Generate an executive summary"
- "Export this as a PDF"
Download Data
Request raw data for further analysis:
- "Download this as a CSV"
- "Export the underlying data"
Tips for Best Results
Do This
- Be specific about metrics: "Total revenue" vs "count of orders"
- Mention time periods: "Last quarter", "YTD", "in 2024"
- Name your dimensions: "by region", "per product category"
- Ask one thing at a time: Break complex questions into steps
Avoid This
- Vague requests without clear metrics
- Multiple unrelated questions in one message
- Assuming abbreviations are understood — spell them out first
How to Reset
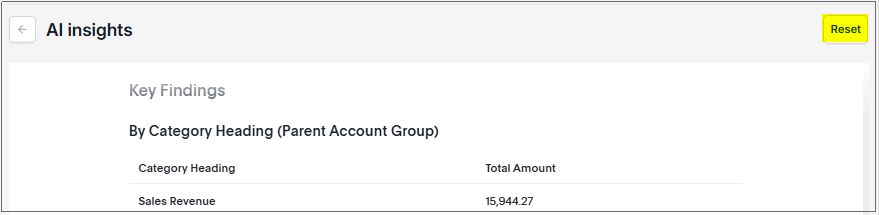
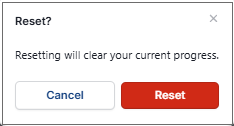
To clear the current progress, select the Reset option.
Updated September 2026